About
Driven and accomplished data visualization developer living in San Francisco, California.
I have a strong business and client background, with startup experience working on mission critical products. I like to think I am both a passionate creative and an analytical thinker. I enjoy both designing and coding projects from start to finish, but also speaking about and teaching my work.
I am currently working on a web components library of financial visualizations at Atom Finance![]() , while teaching as an adjunct lecturer in the CUNY Data Visualization and Analysis
, while teaching as an adjunct lecturer in the CUNY Data Visualization and Analysis![]() program.
program.
Work
Atom Finance UI Components
At Atom Finance, I have had the opportunity to work on a mission critical project bringing our frontend financial visualizations to our B2B clients. After extensive research and development, I've introduced HTML web components into our B2B offering to help our partners visualize our data. These components complete the data fetch, manipulate the data, and visualize the results. All of the visualizations have been designed and developed in house.
This new project is proprietary, and the code includes patent pending details, but you can explore more about how they help our partners atatom.finance![]()
Covid-19 Testing Map
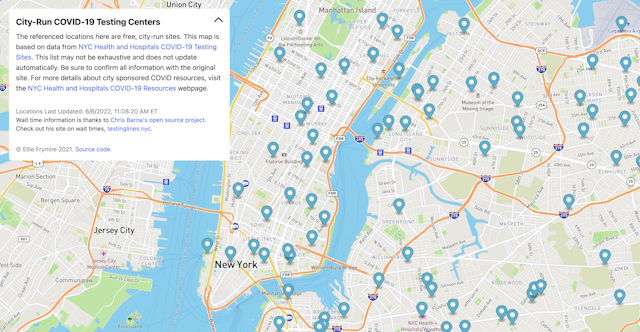
Early in 2022, I was struggling to find a city-run testing location in New York City. The city website![]() included a list of addresses, but not a helpful interactive map. I took matters into my own hands and scraped the addresses and plotted them on a page using mapbox. This project even got some traction in local news.
included a list of addresses, but not a helpful interactive map. I took matters into my own hands and scraped the addresses and plotted them on a page using mapbox. This project even got some traction in local news.![]()
Advising and Teaching
In 2020, along with my colleague Aucher Serr, I built an interactive data visualization class curriculum from the ground up, inspired by our own masters and our work in the industry. After our first class, we built a second, advanced studio course to follow. These courses have evolved over the years, but remain a critical component of CUNY's Data Analysis and Visualization![]() masters program. To learn more, you can check out the latest repository for the introduction course, or the projects from the latest iteration of the studio course (students are of course the sole owners of their work).
masters program. To learn more, you can check out the latest repository for the introduction course, or the projects from the latest iteration of the studio course (students are of course the sole owners of their work).
Projects at Two-N
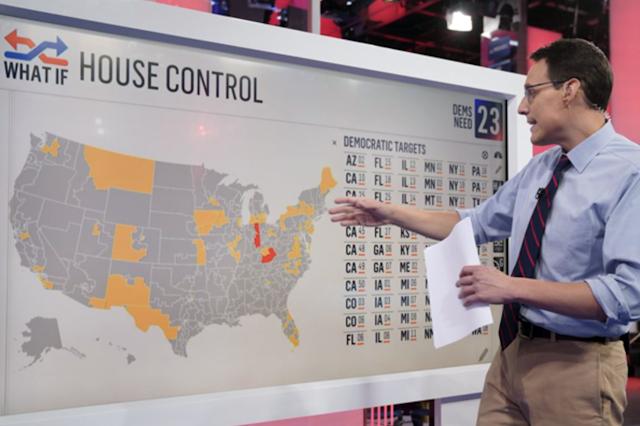
I worked on a number of impactful projects during my time at Two-N. To name a few, I was a primary developer for theNBC Elections Map![]() ,MRP Tool
,MRP Tool![]() ,Evvy's Data Reports
,Evvy's Data Reports![]() , andLevel ETF's fund lookthrough
, andLevel ETF's fund lookthrough![]() . I contributed directly with NBC graphics during the elections cycle, which resulted in a few bylines
. I contributed directly with NBC graphics during the elections cycle, which resulted in a few bylines![]() . Some projects are not featured due to client restrictions, but I also worked on a financial services reporting tool, a marketing data exploration project, a map assisting food donations, and many more.
. Some projects are not featured due to client restrictions, but I also worked on a financial services reporting tool, a marketing data exploration project, a map assisting food donations, and many more.
#metoo
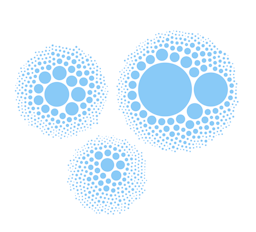
For my final thesis while pursuing my Masters in Data Visualization, I scraped nearly 1.4 million tweets from the public twitter search page to analyze the language within. Using kmeans cluster analysis, I find themes in the tweets and seek to answer the question: "what are people really saying about #metoo?" This thesis took me all over the world — I spoke about it at Antenna during Dutch Design Week, the Design Indaba Conference in Cape Town, as a lightning talk at Eyeo Festival in Minneapolis, and as a d3.js meet up talk.